The original article is in : http://blogs.manageengine.com/appmanager/2011/02/09/identify-java-code-consuming-high-cpu-in-linux-linking-jvm-thread-and-linux-pid/
We can easily identify a problematic java code which leads to high
CPU utilization in Linux. Let me explain the steps with the following
example,
- package test;
-
- public class ThreadDumpTest {
- public void test(){
- for (int i = 0; i < 10 ; i++) {
- Thread th=new Thread(new TR(i));
- th.setName(“MyThread-”+(1000+i));
- th.start();
- }
- }
- public static void main(String[] args) {
- ThreadDumpTest t=new ThreadDumpTest();
- t.test();
- }
- private class TR implements Runnable{
- int ins=0;
- TR(int i){
- ins=i;
- }
- public void run(){
- while (true) {
- if(ins!=5) {
- try {
- Thread.sleep(10000);
- } catch (Exception e) {
- e.printStackTrace();
- }
- }
- }
- }
- }
- }
In the above example, all the threads are in while loop. Except ‘MyThread-1005
‘ thread, all other threads will sleep 10 secs inside the loop. The ‘MyThread-1005
‘ thread will not enter sleep part, so it will run in while loop without sleep. Due to while loop, the ‘MyThread-1005
‘ thread will leads to high CPU utilization.
How to identify ?
Step 1 :
Execute ‘
top
‘ command on the console. You can see the ‘java’ command with PID 7074 utilized
97%
of CPU.
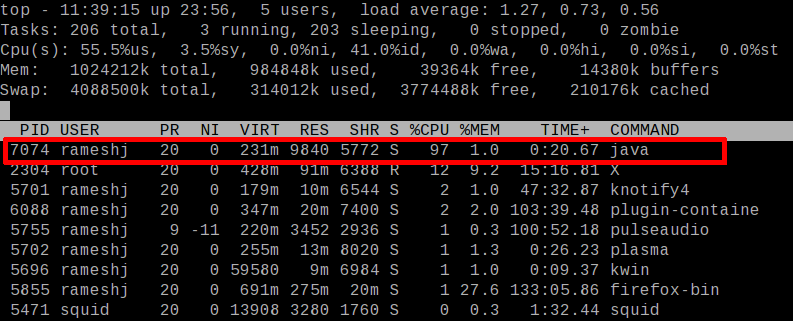
Step 2 :
The top command displays the process list like the above image. Press ‘
Shift + h
‘ and wait few secs. You can see ‘
Show threads on
‘
message in the top console. Now, you can see thread level details like
CPU/Memory utilization. You can see a ‘java’ command thread with PID
7087 utilized
94%
of CPU.
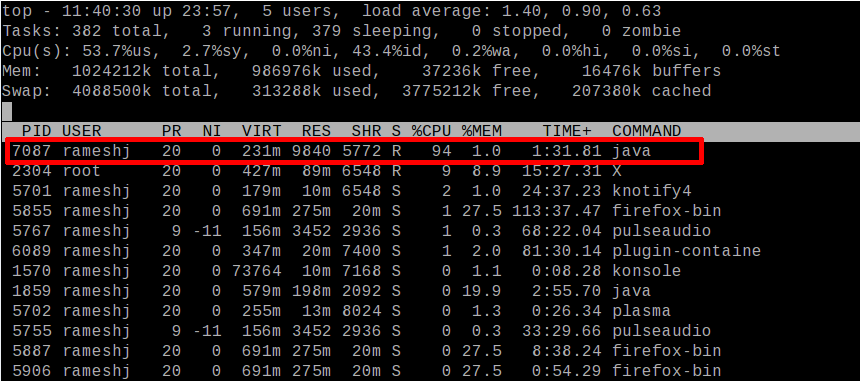
Step 3:
The identified problematic thread PID ( 7087 ) is in decimal format.
Convert it into hexadecimal format
. The respective hexadecimal for 7087 is 1BAF. And convert it into lowercase (1baf ).
Step 4:
Take thread dump and search the converted hexadecimal PID ( 1baf ) in the thread dump. You can find the hex PID as ‘nid
‘ (with ’0x’) of the thread trace. From the trace, you can find ‘MyThread-1005
‘
is the problematic thread in the test program. And using the thread
trace you can identify the problematic code and fix the problem.
- [rameshj@rameshj thread]$ java test/ThreadDumpTest
- ^\Full thread dump Java HotSpot(TM) Client VM (1.5.0_06-b05 mixed mode):
- “DestroyJavaVM” prio=1 tid=0x083d2d78 nid=0x1ba2 waiting on condition [0x00000000..0xbff4bf60]
- “MyThread-1009″ prio=1 tid=0x08510a88 nid=0x1bb3 waiting on condition [0xa9cca000..0xa9ccb020]
- at java.lang.Thread.sleep(Native Method)
- at test.ThreadDumpTest$TR.run(ThreadDumpTest.java:45) &nbs
p;
- at java.lang.Thread.run(Thread.java:595)
- “MyThread-1008″ prio=1 tid=0×08510318 nid=0x1bb2 waiting on condition [0xa9d4b000..0xa9d4bea0]
- at java.lang.Thread.sleep(Native Method)
- at test.ThreadDumpTest$TR.run(ThreadDumpTest.java:45)
- at java.lang.Thread.run(Thread.java:595)
- “MyThread-1007″ prio=1 tid=0x0850f298 nid=0x1bb1 waiting on condition [0xa9dcc000..0xa9dccf20]
- at java.lang.Thread.sleep(Native Method)
- at test.ThreadDumpTest$TR.run(ThreadDumpTest.java:45)
- at java.lang.Thread.run(Thread.java:595)
- “MyThread-1006″ prio=1 tid=0x0850d818 nid=0x1bb0 waiting on condition [0xa9e4d000..0xa9e4dda0]
- at java.lang.Thread.sleep(Native Method)
- at test.ThreadDumpTest$TR.run(ThreadDumpTest.java:45)
- at java.lang.Thread.run(Thread.java:595)
- “MyThread-1005
” prio=1 tid=0x0850c9f8 nid=0x1baf
runnable [0xa9ece000..0xa9ecee20]
- at test.ThreadDumpTest$TR.run(ThreadDumpTest.java:43)
- at java.lang.Thread.run(Thread.java:595)
- “MyThread-1004″ prio=1 tid=0x0850b8e8 nid=0x1bae waiting on condition [0xa9f4f000..0xa9f500a0]
- at java.lang.Thread.sleep(Native Method)
- at test.ThreadDumpTest$TR.run(ThreadDumpTest.java:45)
- at java.lang.Thread.run(Thread.java:595)
- “MyThread-1003″ prio=1 tid=0x0850aac8 nid=0x1bad waiting on condition [0xa9fd0000..0xa9fd1120]
- at java.lang.Thread.sleep(Native Method)
- at test.ThreadDumpTest$TR.run(ThreadDumpTest.java:45)
- at java.lang.Thread.run(Thread.java:595)
- “MyThread-1002″ prio=1 tid=0x085099b8 nid=0x1bac waiting on condition [0xaa051000..0xaa051fa0]
- at java.lang.Thread.sleep(Native Method)
- at test.ThreadDumpTest$TR.run(ThreadDumpTest.java:45)
- at java.lang.Thread.run(Thread.java:595)
- “MyThread-1001″ prio=1 tid=0x08508a28 nid=0x1bab waiting
on condition [0xaa0d2000..0xaa0d3020]
- at java.lang.Thread.sleep(Native Method)
- at test.ThreadDumpTest$TR.run(ThreadDumpTest.java:45)
- at java.lang.Thread.run(Thread.java:595)
- “MyThread-1000″ prio=1 tid=0×08508520 nid=0x1baa waiting on condition [0xaa153000..0xaa153ea0]
- at java.lang.Thread.sleep(Native Method)
- at test.ThreadDumpTest$TR.run(ThreadDumpTest.java:45)
- at java.lang.Thread.run(Thread.java:595)
- “Low Memory Detector” daemon prio=1 tid=0x0843cf58 nid=0x1ba8 runnable [0x00000000..0x00000000]
- “CompilerThread0″ daemon prio=1 tid=0x0843b930 nid=0x1ba7 waiting on condition [0x00000000..0xaa3eb808]
- “Signal Dispatcher” daemon prio=1 tid=0x0843a9d0 nid=0x1ba6 waiting on condition [0x00000000..0x00000000]
- “Finalizer” daemon prio=1 tid=0×08430740 nid=0x1ba5 in Object.wait() [0xaa52c000..0xaa52d120]
- at java.lang.Object.wait(Native Method)
- – waiting on <0xaa6b0848> (a java.lang.ref.ReferenceQueue$Lock)
- at java.lang.ref.ReferenceQueue.remove(ReferenceQueue.java:116)
- – locked <0xaa6b0848> (a java.lang.ref.ReferenceQueue$Lock)
- at java.lang.ref.ReferenceQueue.remove(ReferenceQueue.java:132)
- at java.lang.ref.Finalizer$FinalizerThread.run(Finalizer.java:159)
- “Reference Handler” daemon prio=1 tid=0x0842e898 nid=0x1ba4 in Object.wait() [0xaa5ad000..0xaa5adfa0]
- at java.lang.Object.wait(Native Method)
- – waiting on <0xaa6b0758> (a java.lang.ref.Reference$Lock)
- at java.lang.Object.wait(Object.java:474)
- at java.lang.ref.Reference$ReferenceHandler.run(Reference.java:116)
- – locked <0xaa6b0758> (a java.lang.ref.Reference$Lock)
- “VM Thread” prio=1 tid=0x0842bb68 nid=0x1ba3 runnable
- “VM Periodic Task Thread” prio=1 tid=0x0843e538 nid=0x1ba9 waiting on condition
Update :
FYI : You can automatically take a thread dump of a Java application
when a high CPU threshold is violated by using Applications Manager.
Learn
more
or
watch
a related video or
download Applications Manager now
.
分享到:


相关推荐
Interop Without PInvoke - Consuming Native Libraries in C#.-DynamicLib
Interop Without PInvoke - Consuming Native Libraries in C#.-StaticLib
A programmer wanting to understand the workings of the Linux VM today literally has no choice but to study the kernel source code, line-by-line - an excruciatingly difficult and time-consuming task....
Enterprise Java Microservices teaches you to design and build JVM-based microservices applications. You'll start by learning how microservices designs compare to traditional Java EE applications. ...
Providing and consuming Web Services in ABAP
Deploy using the JVM's high performance while building your apps in the language you love. This book introduces you to three JRuby deployment strategies that give you the performance and scalability ...
followed by explaining how to install and configure Spark, and refreshes the Java concepts that will be useful to you when consuming Apache Spark's APIs. You will explore RDD and its associated ...
scale concurrency, real-time performance expectations, multi-core support, and efficiently consuming services without constantly managing I/O blocks. Although it's possible to solve most of these ...
consumer-es6-module-example 一个使用jspm在客户端上使用的应用程序。 专为在FOWA上的演讲而设计:)
你可以阅读建立要设置此项目,请首先克隆存储库$ git clone https://github.com/fisayoafolayan/consuming-restful-api-in-react.git 将工作目录更改为项目目录$ cd consuming-restful-api-in-react跑安装npm模块$ ...
Create React App入门 该项目是通过引导的。 可用脚本 在项目目录中,可以运行: npm start 在开发模式下运行应用程序。打开在浏览器中查看它。 如果您进行编辑,则页面将重新加载。您还将在控制台中看到任何棉绒...
invoking, mocking and testing (functional and load) of SOAP/WSDL and REST/EADL based Web Services over HTTP. It is mainly aimed at developers/testers providing and/or consuming web services (java, ...
invoking, mocking and testing (functional and load) of SOAP/WSDL and REST/EADL based Web Services over HTTP. It is mainly aimed at developers/testers providing and/or consuming web services (java, ...
14.4 Short Code: A Costly and Time-Consuming Setup 218 14.5 FSG Architecture 219 References 220 CHAPTER 15 Numbering Plan Creation and Maintenance Algorithms 221 15.1 Purpose of Computing Numbering ...
Using Perl-Style regexes to identify functions in your syntax-highlighted files and populate the function list Autocorrect keywords in UltraEdit/UEStudio How to enable and disable autocorrect keywords...
CT is considered a hard problem due to its exponential complexity: A system with 30 choice items may need to explore 230 combinations and this is time- and effort-consuming. Many approaches have been...
If getting started with this new framework sounds difficult and time-consuming, don’t worry, we’ve got you covered. ARKit by Tutorials helps you learn ARKit the quick and easy way: by following fun...
If getting started with this new framework sounds difficult and time-consuming, don’t worry, we’ve got you covered. ARKit by Tutorials helps you learn ARKit the quick and easy way: by following fun...
Easy Main Menu is your one stop solution for all the things you want to have in a menu : - Start Game * New Game * Save/Load Game - Options * Game Options * Graphics Options * Control ...
gs-consuming-rest, 使用 RESTful Web服务 目录你将构建什么。你需要什么。获取REST资源使应用程序执行正常。使用 Spring Boot 服务管理应用程序生命周期。摘要文件另请参阅本指南引导你完成创建使用rest式web服务的...